
In this article you will find information about the pension fund funding ratios in the Netherlands. At the bottom of the page you will find an up-to-date funding ratio list of all Dutch pension funds.
What is a funding ratio?
The funding ratio is the relationship between the total contributed capital (aum: asset under management) of a pension fund and the pension liabilities. In short, it is the ratio between the total available assets and liabilities. The funding ratio formula is as follows:

A funding ratio above 100% means that there are more asset under management then there are pension liabilities. A funding ratio below 100% means that the pension fund is underfunded. In that case the pension fund has not enough assets to meet the current pension obligations.
For example: If a pension fund has € 105 in assets under management and € 100 worth of liabilities. The funding ratio is 105%.
Difference between funding ratio and policy funding ratio
The funding ratio (also known as the monthly funding ratio) is calculated monthly. It is a snapshot of the financial position of the pension fund.
The policy funding ratio is the average funding ratio of the past twelve months. The policy funding ratio is used to determine whether the pensions can be increased (indexation) of should be reduced (cut).
Law
When the policy funding ratio is below the required level, the pension fund must write a recovery plan to return to the required level within 10 years. If this is not possible or if the policy funding ratio is below 105% over 5 years, the pension fund must reduce (cut) its pensions.
Top 5 pension funds
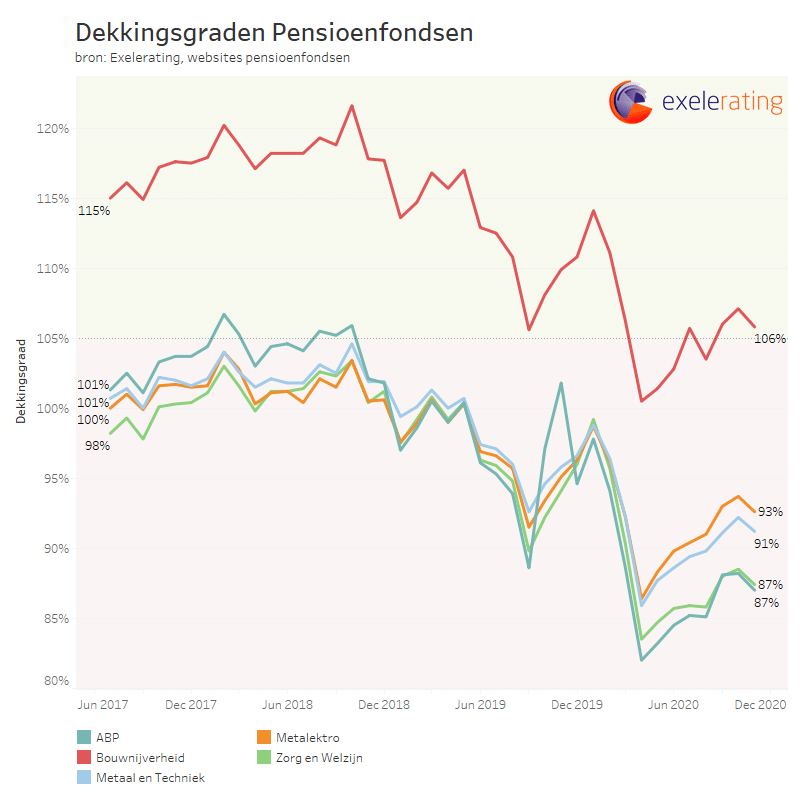
The graphs below shows the funding ratio of the top 5 largest pension funds in the Netherlands. The downward trend is mainly caused by a fall of the interest rate. In addition, the corona crisis (March 2020) also had a negative effect on the funding ratio.
List of funding ratios in The Netherlands
Below you find an overview of the funding ratios and policy funding ratios of all Dutch pension funds. The list shows the most recent published funding ratio. This data is updated weekly in our database.
| Pension fund | Date | Funding ratio | Policy funding ratioPolicy funding ratio |
|---|---|---|---|
| Abbott Nederland | 2025-03-31 | 129.1% | |
| ABN AMRO Bank | 2025-03-31 | 128.0% | 126.0% |
| ABP | 2025-03-31 | 115.6% | 113.8% |
| Achmea | 2025-03-31 | 136.7% | 136.6% |
| AHOLD | 2025-03-31 | 127.1% | |
| Alliance | 2025-03-31 | 122.2% | 123.4% |
| APF | 2025-03-31 | 120.6% | 122.4% |
| Apothekers | 2025-03-31 | 123.7% | 122.7% |
| Architectenbureaus | 2025-03-31 | 126.0% | 124.2% |
| AT&T Nederland | 2025-03-31 | 126.0% | 124.0% |
| Atos Origin | 2025-03-31 | 127.2% | 127.0% |
| AVEBE | 2025-03-31 | 137.7% | 139.4% |
| Avery Dennison | 2021-05-31 | 121.8% | |
| Bakkersbedrijf BPF | 2025-03-31 | 118.5% | 117.6% |
| Banden- en Wielenbranche | 2025-03-31 | 108.9% | 108.0% |
| Beroepsvervoer over de Weg | 2025-03-31 | 116.5% | 112.8% |
| Betonproduktenindustrie | 2025-03-31 | 114.2% | 113.3% |
| Bibliotheken openbare | 2025-03-31 | 135.0% | 135.8% |
| Bisdommen | 2025-03-31 | 154.0% | |
| Bouwmaterialen | 2025-03-31 | 117.3% | 113.0% |
| Bouwnijverheid | 2025-03-31 | 129.7% | 127.0% |
| Bpf Foodservice | 2025-03-31 | 121.8% | 121.1% |
| BPL | 2025-03-31 | 121.2% | 118.3% |
| British American Tobacco | 2025-02-28 | 129.2% | 135.1% |
| Brocacef | 2025-03-31 | 128.2% | |
| Calpam | 2024-10-31 | 177.9% | 179.7% |
| Campina | 2025-03-31 | 129.9% | 130.5% |
| Cap Gemini Nederland | 2025-03-31 | 110.5% | 110.5% |
| Cargill | 2025-03-31 | 120.1% | 119.5% |
| Citigroup Nederland | 2025-03-31 | 124.4% | 125.4% |
| Coram | 2024-10-31 | 120.4% | |
| Cosun | 2025-03-31 | 124.1% | 124.4% |
| CRH | 2024-12-31 | 116.8% | 116.1% |
| Delta Lloyd | 2025-03-31 | 133.0% | 132.3% |
| Detailhandel | 2025-03-31 | 123.1% | 122.5% |
| DHL Nederland | 2025-03-31 | 137.1% | 139.4% |
| Dierenartsen | 2025-03-31 | 117.0% | 114.8% |
| Dow | 2025-03-31 | 114.9% | 114.7% |
| DSM Nederland | 2025-03-31 | 126.9% | 125.7% |
| Ecolab | 2025-03-31 | 137.4% | 139.6% |
| Essity | 2025-03-31 | 120.1% | 118.2% |
| Forbo | 2025-03-31 | 116.5% | 115.4% |
| Fysiotherapeuten | 2025-03-31 | 120.7% | 116.8% |
| Gasunie | 2025-03-31 | 139.4% | 141.5% |
| Gazelle psf | 2025-03-31 | 131.2% | 129.3% |
| Geveke | 2025-03-31 | 107.7% | 108.9% |
| Groothandel | 2025-03-31 | 111.2% | 109.7% |
| Hagee | 2025-03-31 | 129.3% | 129.6% |
| HAL | 2023-12-31 | 209.2% | |
| HaskoningDHV | 2025-03-31 | 123.9% | 124.7% |
| Heineken | 2025-03-31 | 145.6% | |
| Honeywell | 2025-03-31 | 140.9% | 140.6% |
| Hoogovens | 2025-04-30 | 126.2% | 124.4% |
| Horecabedrijf | 2025-03-31 | 137.0% | 135.0% |
| Huisartsen | 2025-03-31 | 131.8% | |
| Huntsman Rozenburg | 2025-03-31 | 142.8% | |
| IBM Nederland | 2025-03-31 | 128.9% | 132.0% |
| IFF | 2025-03-31 | 136.8% | 134.7% |
| IKEA | 2025-03-31 | 135.8% | 133.6% |
| ING | 2025-03-31 | 141.7% | |
| ING Bank CDC fonds | 2025-03-31 | 130.0% | 132.0% |
| Kappersbedrijf | 2025-03-31 | 115.8% | 109.6% |
| Kas Bank | 2025-02-28 | 125.3% | 127.0% |
| KLM Algemeen | 2025-03-31 | 135.3% | 135.6% |
| KLM Vliegend Personeel | 2025-03-31 | 156.5% | 161.9% |
| KLM-Cabinepersoneel | 2025-03-31 | 121.6% | 124.3% |
| Koopvaardij | 2025-03-31 | 120.2% | 119.4% |
| KPN | 2025-03-31 | 126.2% | 127.3% |
| Kring Progress (Unilever) | 2025-01-31 | 166.0% | 168.0% |
| Lanschot | 2024-12-31 | 122.5% | 122.6% |
| Levensmiddelenbedrijf | 2025-03-31 | 113.3% | 110.7% |
| Lloyd's Register Nederland | 2025-02-28 | 121.0% | 120.8% |
| Loodsen | 2024-12-31 | 125.4% | 124.6% |
| Medewerkers apotheken | 2025-03-31 | 109.0% | 108.3% |
| Media PNO | 2025-03-31 | 119.6% | 117.8% |
| Mediahuis Nederland | 2025-03-31 | 123.4% | 121.9% |
| Medische Specialisten | 2025-03-31 | 143.3% | 143.7% |
| Mercer | 2025-03-31 | 125.0% | 124.1% |
| Metaal en Techniek | 2025-03-31 | 110.5% | 109.2% |
| Metalektro, bedrijfstakpensioenfonds | 2025-03-31 | 116.4% | 113.8% |
| Metro | 2025-03-31 | 101.0% | 101.0% |
| Mode-, Interieur-, Tapijt- en Textielindustrie | 2025-03-31 | 123.6% | 120.2% |
| Molenaarspensioenfonds | 2025-03-31 | 122.9% | |
| MSD | 2024-12-31 | 145.1% | 146.9% |
| Nederlandsche Bank | 2025-03-31 | 137.3% | 137.9% |
| Nedlloyd | 2025-02-28 | 117.9% | 118.9% |
| NN CDC fonds | 2025-03-31 | 130.0% | 128.0% |
| Notariaat | 2025-03-31 | 113.5% | 112.9% |
| Oak Pensioen | 2025-03-31 | 126.0% | 125.3% |
| Particuliere beveiliging | 2025-03-31 | 129.2% | 126.1% |
| Pensura | 2024-10-31 | 136.7% | 137.3% |
| Personeelsdiensten | 2024-12-31 | 121.4% | |
| Personeelspensioenfonds APG | 2024-12-31 | 124.1% | |
| PGB | 2025-03-31 | 118.0% | 117.2% |
| Philips | 2025-03-31 | 120.7% | 123.6% |
| Pon | 2025-03-31 | 113.6% | 111.8% |
| PostNL | 2025-03-31 | 131.3% | 132.5% |
| Provisum | 2025-03-31 | 147.8% | 148.2% |
| Rabobankorganisatie | 2025-03-31 | 119.3% | 117.8% |
| Rail & Openbaar Vervoer | 2025-03-31 | 131.8% | 131.7% |
| Recreatie (SPR) | 2025-03-31 | 117.9% | 118.4% |
| Rijn- en Binnenvaart | 2025-03-31 | 138.6% | 137.6% |
| Robeco | 2025-03-31 | 149.4% | |
| Rockwool | 2025-03-31 | 116.8% | 114.3% |
| Roeiers in het Rotterdamse havengebied | 2025-01-31 | 119.7% | |
| SABIC | 2025-03-31 | 120.9% | 120.0% |
| Sagittarius | 2025-04-30 | 132.0% | |
| Samenwerking Slagersbedrijf | 2025-03-31 | 130.7% | 128.9% |
| Schilders-, Afwerkings- en Glaszetbedrijf | 2025-03-31 | 135.3% | 131.8% |
| Schoonmaak- en Glazenwassersbedrijf | 2025-03-31 | 117.7% | 114.3% |
| Shell | 2025-03-31 | 131.5% | 133.0% |
| Smurfit Kappa Nederland | 2025-03-31 | 127.8% | 127.9% |
| SNS Reaal Groep | 2025-03-31 | 122.2% | 119.9% |
| Sportfondsen | 2025-03-31 | 130.0% | 129.1% |
| Staples | 2025-03-31 | 129.0% | 129.1% |
| Tandartsen en Tandarts-specialisten | 2025-03-31 | 125.7% | 127.6% |
| TDV | 2025-03-31 | 137.2% | 139.6% |
| Thales | 2025-03-31 | 127.9% | 129.9% |
| TNO | 2025-03-31 | 120.5% | 124.0% |
| Trespa | 2025-02-28 | 113.0% | 112.8% |
| UWV | 2025-03-31 | 118.8% | 119.5% |
| Verloskundigen | 2025-02-28 | 114.9% | 113.4% |
| Vlakglas, Verf, het Glasbewerkings- en het Glazeniersbedrijf | 2025-03-31 | 124.4% | 122.5% |
| Vlees- en Vleeswarenindustrie en de Gemaksvoedingindustrie | 2025-03-31 | 118.1% | 116.1% |
| Vopak | 2025-03-31 | 131.5% | 131.5% |
| Waterbouw BPF | 2025-03-31 | 143.4% | |
| Werk en (re)Integratie | 2024-12-31 | 124.8% | |
| Witteveen & Bos | 2025-03-31 | 125.2% | 118.9% |
| Wolters Kluwer Nederland | 2024-12-31 | 127.4% | 131.1% |
| Woningcorporaties | 2025-03-31 | 131.3% | 130.4% |
| YARA Nederland | 2024-09-30 | 142.8% | 141.6% |
| Zoetwarenindustrie | 2025-03-31 | 124.9% | 123.1% |
| Zorg en Welzijn | 2025-03-31 | 114.3% | 110.2% |
| Zorgverzekeraars | 2025-03-31 | 124.2% | 121.0% |
| Zuivel en aanverwante industrie | 2025-03-31 | 120.6% | 119.6% |